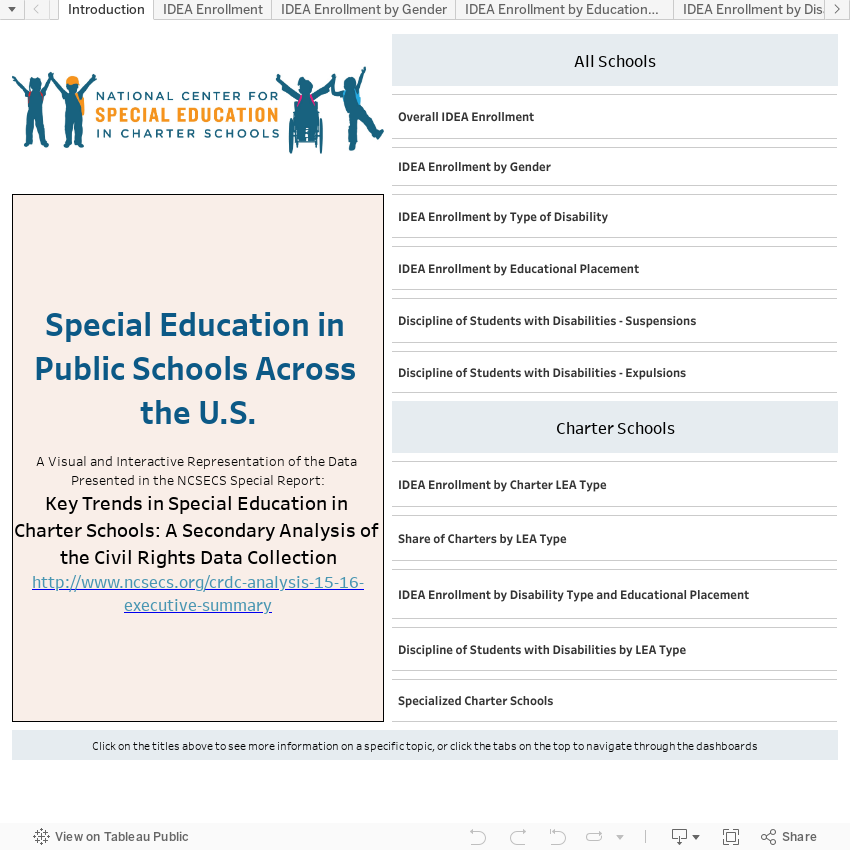
The interactive data visualization below is an additional resource on the state of special education in charter schools and traditional public schools, as seen from the analysis of the CRDC and IDEA data collected by the U.S. Department of Education. With this visualization, we aim to further our goal of establishing and communicating the facts about special education, as well as informing both policy and practice to ensure equity for students with a range of learning difference.
Comments are closed.